Dharug Country
October 2022
Produced as part of a geographic study of development priorities in Western Sydney, the Infrastructure Red Rooster Line maps passenger rail and motorway projects built, underway or planned within Dharug Country/Greater Sydney under the past eleven years of the State Significant Infrastructure (SSI) environmental planning and assessment pathway. The map is overlaid onto the geography of population density and income inequality across the region, where red indicates neighbourhoods with median income figures in the lowest 20% of the state, and blue indicates neighbourhoods in the highest 20%. This geography of inequality has come to be symbolised by the Red Rooster Line, the line connecting the easternmost outlets of the fast-food chain.
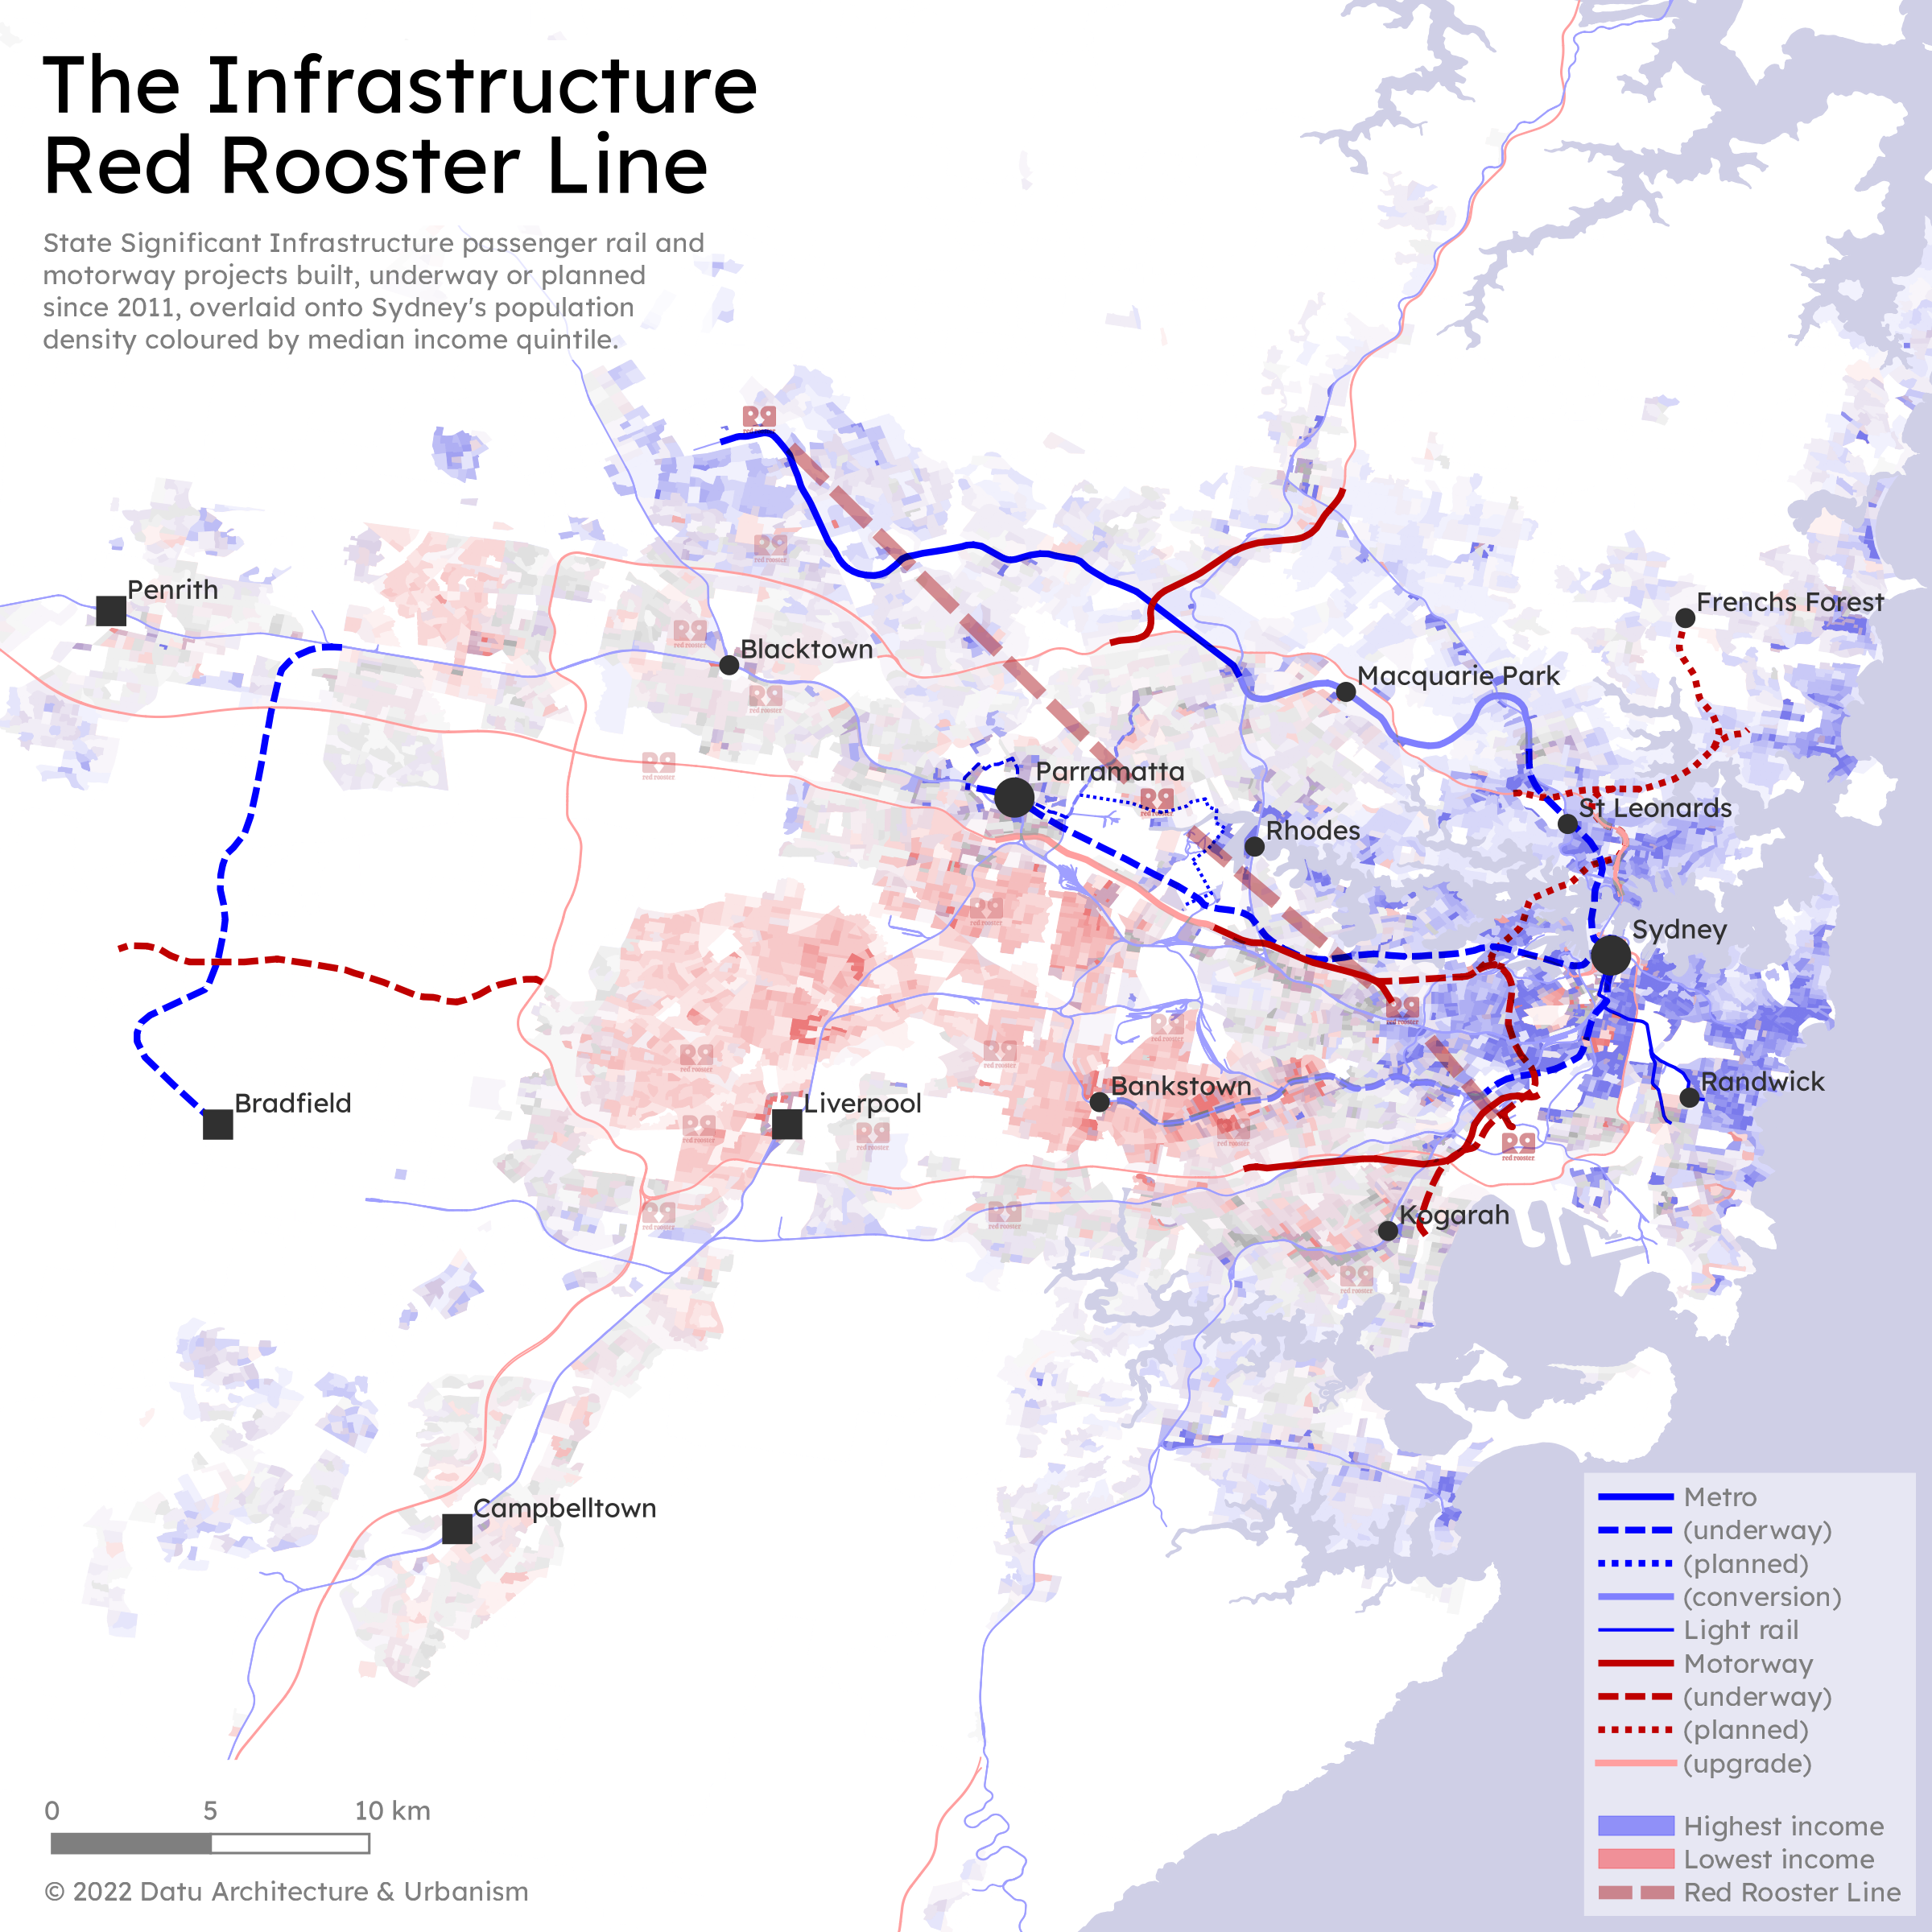
The Infrastructure Red Rooster Line shows that recent projects have been overwhelmingly concentrated in the northeast half of the region, criss-crossing in numerous precincts internally and driving commuters towards the Sydney city centre in particular. By contrast, very little has been in the southwest half of the region, and predominantly at its fringes rather than criss-crossing within it. The key exceptions in the southwest half are the two projects underway towards Bradfield, a greenfield site far outside the periphery of the existing populations of Western Sydney, not a new employment destination centrally located within them.
It is true that large numbers of jobs will remain in the Sydney city centre and that infrastructure needs to be built to bring workers there, but it is also true that there is a need to increase the numbers of jobs available within the major employment precincts of Western Sydney and to build infrastructure that will bring workers into those centres as well.
The Infrastructure Red Rooster Line shows that this objective is not being achieved evenly across Greater Sydney. What the projects in the northeast half of the region and the projects around Bradfield have in common is that neither are significantly integrated into the existing low-income populations of Western Sydney, nor improve their commutes towards the major employment centres within their own districts, exemplified by the absence of new infrastructure into Liverpool, Penrith, Blacktown and Campbelltown.
While commuting opportunities grow for high-income Sydneysiders and the future population of the Bradfield area, hundreds of thousands of low-income Sydneysiders continue to be forced to go well outside their own districts for work, with little modern infrastructure to get them there. This is despite many years of planning hoping to connect Western Sydneysiders to work opportunities within their ‘30-minute city’ radius.
There is a mismatch between the rhetoric surrounding Western Sydney and the actual spatial structure of the region. Part of the problem may be that we simply don’t know how to visualise the scale of Western Sydney, the distances between the investments being made and their imagined beneficiaries. This map begins to provide that visualisation.
The Infrastructure Red Rooster Line suggests that infrastructure planning over the past eleven years has reinforced rather than redressed the income inequality between the northeast and southwest halves of the Greater Sydney region. It is hoped that with better tools to visualise the scale of the problem, the next eleven can be spent bringing equality back to Western Sydney.